Measurement of a 455kHz IF transformer
Measurement of a 455kHz IF transformer

Fellow Radiophiles,
After I posted my recent report on "Modificaitons for HiFi AM reception", I found that the two remaining FM IF transformers, that had not been updated with new capacitors, were failing intermittently. The mica disc capacitors had developed cuts that split two of the four capacitors in half intermittently. A very odd failure. So I replaced the defective internal caps with external 22pF caps for each of the windings in the FM IF transformer that is driven by the mixer in the the FM IF transformer that drives the limiter stage with the 6BH6 (originally 12AU6) tube. Each mica disc had two identical caps and only one cap on each disk was damaged with the cut through the mica. The 22pF value was obtained from direct measurements of the caps that were not damaged.
After completing the repair with new 22pf COG ceramic caps, I frequency-swept the second of these transformers by driving the grid of the 19HS6 (originally a 12BA6) in the 2nd IF stage with 10.7MHz+/-100kHz and measured the frequency response as detected by the 6BH6 grid of the following limiter stage via a 1Meg resistor. I was very surprised to see an over-coupled response with the tell-tale double peaks. The peaks were no more than 10% higher than the center frequency response, so I thought this was a lucky benefit to make the overall FM IF response flatter in the +/-100kHz band around 10.7MHz.
Then I realized that if the fixed resonating capacitor has a smaller value than the original design the cores in the transformer would be brought closer together during the alignment to get extra inductance to resonate with the smaller fixed caps. Bringing the cores together would naturally increase the coupling into an overcoupled response. Perhaps the overcoupled response was intended with the 22pF caps after all.
This made me realize that a third method to get overcoupled response in the AM IF stages for wide band 455kHz+/-10kHz response is to simply reduce the external fixed cap value, so the transformer cores would be adjusted closer together into each coil to get more inductance to resonate with the smaller caps at 455kHz. When the cores are brought closer together you get more coupling.
As discussed in my Hifi AM modifications report,the first two methods to achieve over-coupling are the addition of a small pickup coil near the primary, that is wired in series with the secondary. This was common in radios that were designed for wide band AM reception. The other method was to add small (6-8pF) capacitors to bridge the primary and secondary circuits. I used this method in my modifications for wide band AM IF.
Now that HiFi AM radio is all finished, I decided to play with the third method of overcoupling with reduced tank capacitor values on a separate 455kHz AM IF transformer.
455kHz AM IF transformer on test fixture
The photos show a spare 455kHz AM-IF transformer mounted on the test fixture. The test fixture is made with a candy box. It is made of soft nickel plated sheet metal, which is very easy to solder to and to cut or drill. The transformer shield was missing, so I made a shield with copper foil over a plastic tube, which was a very good fit. The shield is necessary for good measurements, because it affects coupling between coils very significantly. The inductance of each coil is also reduced a little bit by the shield.The shield is grounded when in use.
The two dials are for variable 200pF capacitors wired in parallel to each coil. The metal box has a lid on the bottom to seal it completely.
click any figure to enlarge


There are two holes for two 10x scope probes with 10Meg//~15pf input impedance at the front and back. The photo on the left is a back view with the transformer shield removed. The photo on the right is a front view. The 10Meg load is a negligible on the <300k impedance of each tank at 455kHz resonance. The 15pF of the probes is accommodated with an adjustment to the variable capacitors and becomes part of the total resonating capacitance.
The on the right shows the red alligator clip from the RF sweep generator clipped to a 1Meg resistor that is connected directly to the first tank. This 1Meg resistor does reduce the realizable Q somewhat, but it is also about the same as the plate impedance of an IF amplifier pentode. The 1Meg generator coupling resistor was purposely kept outside the box to avoid coupling through stray capacitance to the secondary circuit. This would distort the secondary response.
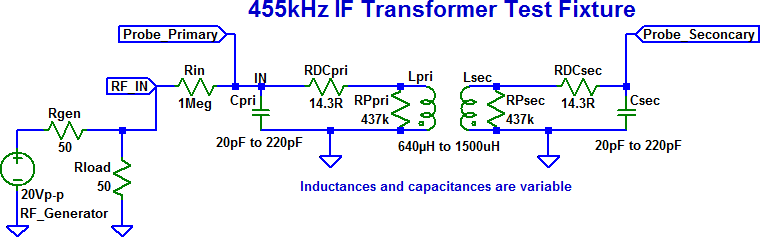
The schematic shows the test fixture connections and also a basic model for the tanks with shunt and series resistance losses. The series resistance in this case is just the DC resistance. Any series AC losses caused by skin effect are lumped into the shunt resistance.
Frequency sweep with the original internal mica capacitors
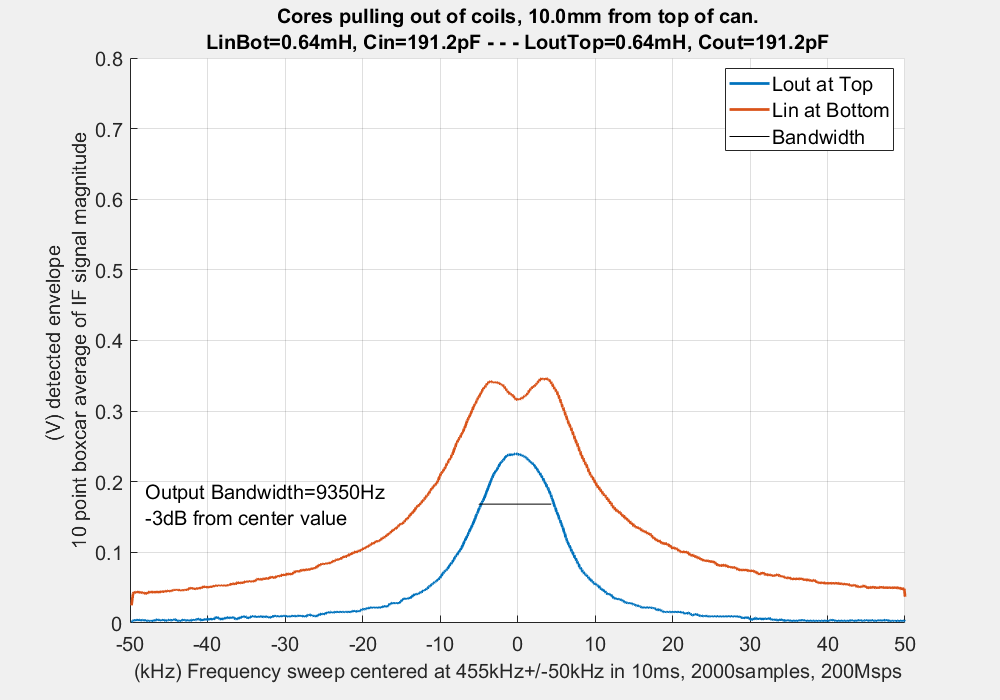
The plots sweep +/-50kHz centered at 455kHz. The horizontal axis is in kHz. The vertical axis is in volts for the IF signal envelope. The orange curves show the primary response and the blue curves show the secondary response. A black line under the blue secondary curve shows the measured bandwidth of the blue curve. Each plot has the corresponding values of tank inductance, resonant capacitance and distance of the top core from the top of the IF shield. I have used "in" and "primary" interchangeably as well as "out" and "secondary". The voltage scale was maintained fixed at 0V-800mV throughout the plots.
The primary and secondary inductance is always nominally the same in all the sweeps.
The first plot below on the left shows the response of the primary tank with the secondary tank completely detuned to a high frequency. The 7.6kHz bandwidth indicates a Q=455/7.6=60 when the tank core is in far enough into the coil to get 1.4mH. The Q will be lower with lower inductances because the series losses increase with the increased resonating capacitance.
The second plot shows the original response of the transformer after alignment with the internal 125pF mica disc capacitors. The resulting inductance after alignment at 455kHz was 970uH. Not surprisingly, an undercoupled response is seen at the secondary in the blue trace, but the coupling still widens the overall transformer response to 9.25kHz bandwidth, as compared to the bandwidth of a single tank. The primary tank response shows the dip that is caused by the secondary loading at resonance. The loaded response of the primary is now much wider than without the secondary tank load. This illustrates the fundamental difference between AM-IF strips with coupled resonant tanks in tube designs with single tanks with taps or untuned secondaries that are common in transistor designs. A coupled pair of tanks gives a wider passband response than a sequence of two uncoupled tanks over two stages.
The sweep on the second plot was taken with a low capacitance Tektronix p6201 10x probe with 1.5pF//1MegΩ to get an accurate value of resonance inductance with the internal capacitance.
click any figure to enlarge


Reducing resonance capacitance increases tank coupling
This is now the fun part, where you get full flexibility in the level of overcoupling by selecting different values of inductance/capacitance that resonate at 455kHz.
click any figure to enlarge


The 6 plots were done with forced tank inductance, adjusted resonant capacitance and resulting core gap, as shown in this list:

 640uH, 191.2pF, 20.5mm
800uH, 152.9pF, 16.5mm
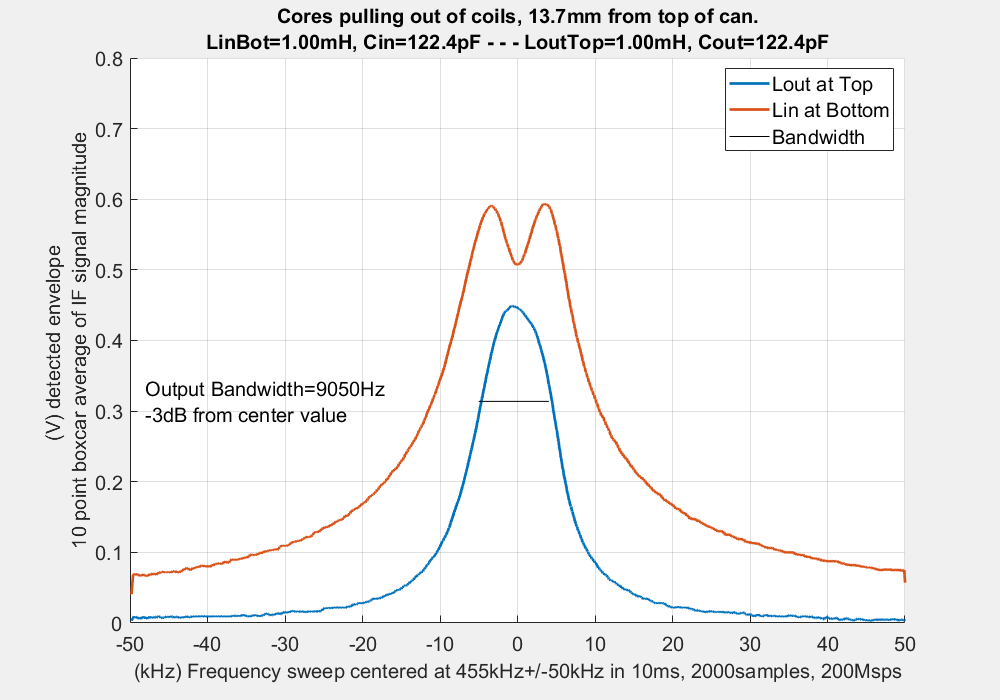
1000uH, 122.4pF, 13.1mm
1200uH, 102.0pf, 9.5mm
1400uH, 87.4pF, 6.5mm
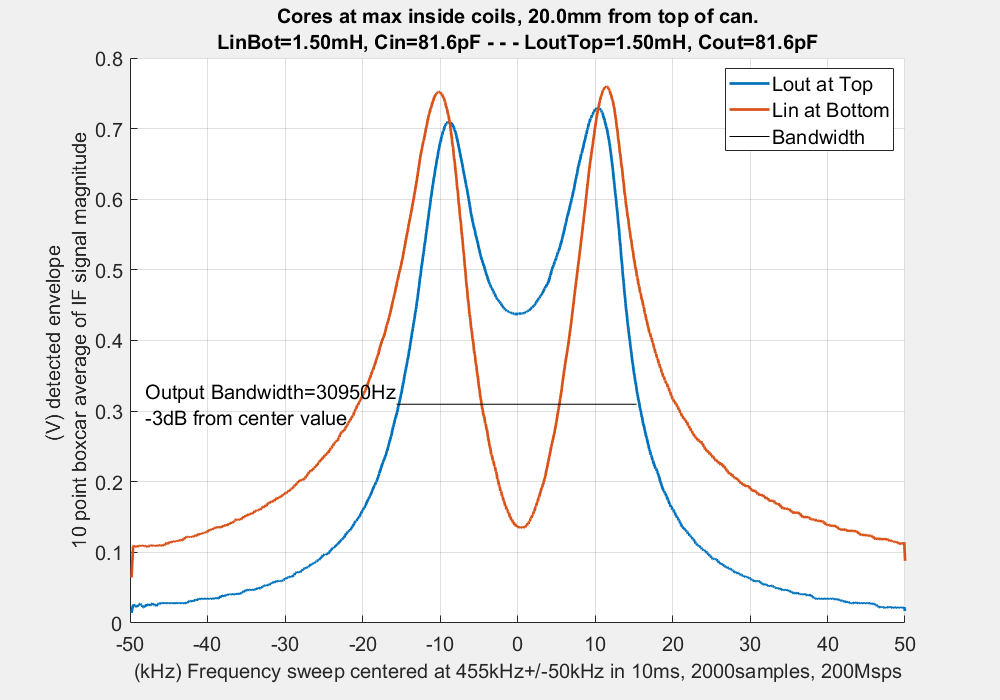
1500uH, 81.6pF, 0.5mm
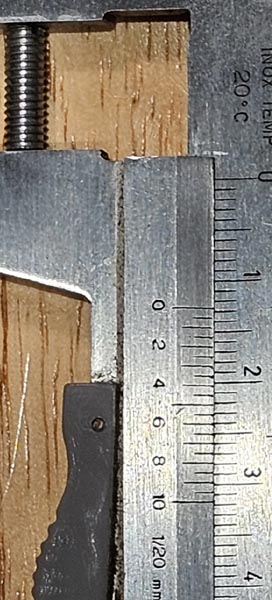
The physical coil and core dimensions are:
Coil height: 8mm
Coil gap: 8mm
Core length: 12.75mm
Core width: 4.0mm
Core slot for screw driver: 1mm
The 1000uH inductance setting was closest to the original 970uH value. As the two tank cores are moved over 10mm each, the gap between them changes dramatically over 20mm, down to nearly zero for the 1500uH. At this point the core is essentially fully inside the core and the inductance does not change as much as the core is moved in further.
The smaller the gap, the more the coupling changes as we see a dramatic difference between the 1400uH and 1500uH results, where the gap shrinks from 6.5mm to 0.5mm. This is the range of gaps that would have been useful in my "Modificaitons for HiFi AM reception". As a commercial design this 1400uH to 1500uH range would not have been practical because there would be too much interaction between the level of coupling between the tanks and the inductance of the tanks. This explains the common use of the additional small secondary winding that is tightly coupled to the primary in wideband AM designs to keep coil coupling and coil inductance independent from each other.
Measurement equipment

I used the very accurate function generator HP3314A for all the frequency sweeps. The accuracy of the sweep was confirmed by comparing points in the sweep response with fixed frequency response. It was also very simple to set the sweep range from 405kHz to 505kHz. There is also a variable marker with 1kHz resolution to assist in finding frequencies along the sweep. The marker is a pulse that comes out of separate output at the back of the generator and pulses when the marker frequency is passed. The marker frequency is shown on the generator display, but was not used in the photo of the oscilloscope. My particular HP3314A has a GPIB computer interface, but I did not use it.
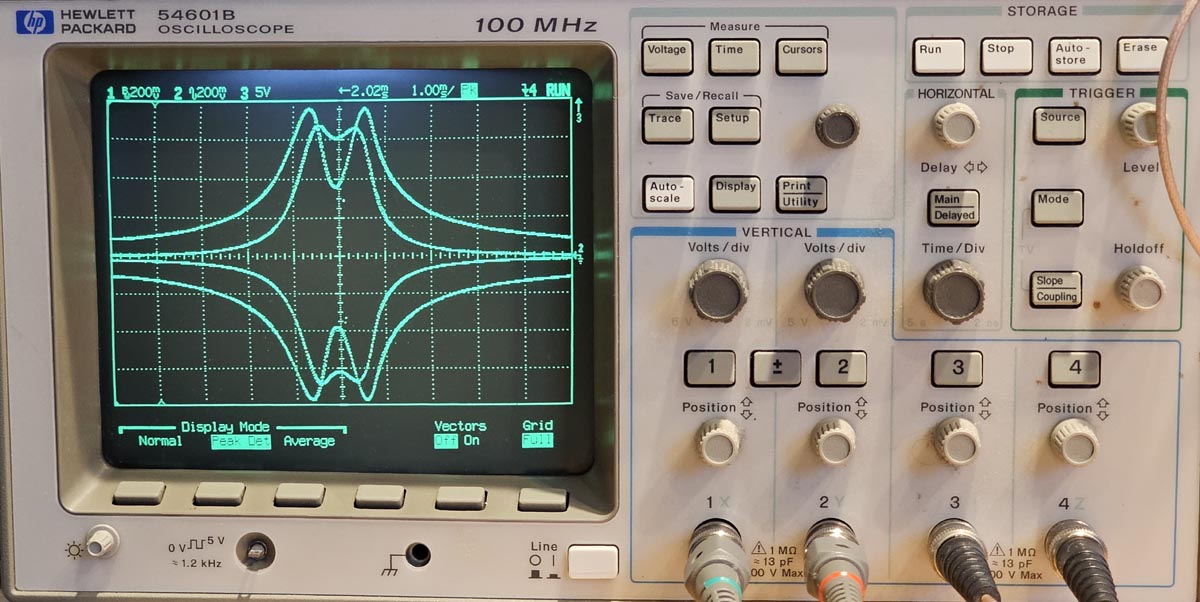
The HP54601B digital oscilloscope collected all the waveform data into Matlab on my PC through a NI GPIB-USB-HS interface. The scope photo shows the envelope of the input and output frequency sweeps. The "Peak Det" waveform function was very useful to save the highest or lowest data point of successive sweeps and outline the envelope. This creates a waveform that alternates between the positive and negative side of the envelope. In Matlab, you just take the magnitude of the result and smooth it further with a 10 element box car window using the convolution function. The result is shown in all the plots above.
A side note on the HP54601B is that the 100 "Trace memories" that are available do not save the waveform, but save instead a screenshot which is not useful for further computation. So all the sweeps were collected live. Each collected waveform was 2000 points long over a 10ms sweep. The waveform is also collected in the relative position set by the horizontal knob, so you can use this knob to get the sweep centered at 455kHz frequency marker pulse (not shown). I could not find a way to download or decode the "Trace memories"
The Tektronix p6201 JFET scope probes have only 1.5pF//10MegΩ with the 10x probe sleeve, plus a 900MHz bandwidth down to DC. TheY have an active JFET buffer for AC coupled signals up to 900MHz in combination with a low frequency LM308 DC opamp to get very good AC and DC accuracy. These two AC and DC signal paths come carefully aligned for a good step response. These probes have a power wire that plubs into older Tektronix oscilloscopes. I use a stand-alone type 1101 probe power supply, so I can use these probes with any scope.
For inductance measurements I use the Rhode&Schwartz BN6100 L-Messgerät. This meter is very accurate for RF inductances. It's principle is to resonate the coil under test with 5nF. It also includes a self-capacitance measurement method, which was very useful to measure the caps that were built into the IF cans without having to disconnect the cans. I also used an M3 Digital LCR Meter. This one is very convenient and was in good agreement when I used a test frequency of 15.6kHz.
All of this is obsolete equipment, many years, or decades out of production, within the reach of the hobbyist in the second hand market. The quality of this gear is usually much higher than new gear in the same second hand price range.
Simulations
Calculation and simulation of coupling factor k
I ran some simulations with LTspice freeware to further understand the overcoupling mechanism. I calculated some parameters directly with the traditional method shown here, but the coupling factor between the tanks was more accurately done empirically, by trial and error to match the real measured frequency response.
Landee et al. have a good explanation of mutual inductance in "Electronics Designers Handbook by Landee, Davis, Albrecht p13-2, McGraw-Hill 1957"
This schematic transformation illustrates how mutual inductance relates to the primary and secondary inductances. The two circuit variants are not equivalent in terms of galvanic isolation. They are equivalent only in values for L and M.
![]()
 From the book: "Mutual inductance can be determined experimentally for any two windings by measuring the inductances of the two coils when connected series-aiding (flux fields in the same direction) and series-opposing (flux fields opposing) and dividing the difference in the two measurements by 4."
LseriesAid and LseriesOppose are the inductance values measured when the windings are wired in series with the fluxes in the same direction (Aid) and, by reversing the terminals in one winding, with the fluxes in opposite direction (Oppose). LseriesAid is always greater than LseriesOppose.
In order to get the coupling factor you will need four inductance measurements as shown in the last of these 4 equations. These measurements are a good starting point to measure k and then adjust it to get a simulated response that matches the measured frequency response.
For example, with the original inductances measured with the M3 LCR meter, Lpri=968.6, Lsec=968uH LseriesAid=1983uH and LseriesOppose=1892, the mutual inductance is 22.75uH and k=0.0235. This value of k was too high for a good fit between the simulated response and the measured response. The simulated k was adjusted to k=0.014 to get a good match between simulated and measured responses. The calculated k=0.0235 actually gave an overcoupled response in simulation with slight double peaks. The plot below shows an under-coupled response, which matches the measured sweep shown above for Lpri=Lsec=970uH.
The M3 LCR meter and R&S BN6100 L-Messgerät both gave similarly high results for k. Simulation provides a good sanity check and improves modeling of the frequency response with the adjustment of the k value.
The inductance measurements were done at a much lower frequency than 455kHz (15.6kHz for M3 meter and 75kHz with BN6100 meter for 900uH). This reduced frequency desensitizes the inductance measurement to stray capacitances.

This schematic simulates the response of the IF transformer as found with the internal 126.1pF capacitors that resonate with the 970uH at 455kHz. The simulation schematic shows two duplicates of the primary tank at Lin1 and Lin2 that are useful to monitor the unloaded response simultaneously and to get the series and shunt losses modelled correctly when the Lin1 and Lin2 responses match. Rsin=14.3Ω is the pure DC resistance, so the series AC losses are lumped in with the shunt resistor Rpin. Rpin is lower than Rpout because it includes the 1MegΩ source impedance of the test setup.
This circuit was simulated with a pure current stimulus to get the results as impedances or transimpedances. The plot scale below has a vertical axis range up to 200kV, which with the 1A stimulus is equivalent to a 200kΩ primary impedance or secondary transimpedance. Note the loading effect of the secondary on the primary near 455kHz. The red curve shows the primary response of Lin1 without secondary loading. The Black curve shows how the loading effect is highest at the resonant peak of the secondary, and is negligible outside the primary pass band.
The impedance scale is also useful to predict the effect of plate impedance when the primary is in the plate circuit of the IF amplifier. Typical pentode plate impedance is in the 500kΩ-1MegΩ range and higher than that under increased AVC control. This means that IF amplifiers are more selective with stronger input signals, which increase the AVC voltage, which raises plate impedance. But this is a relatively small change, given that the plate impedance is still at least 2x the tank impedance in this case when the AVC control is near zero. All the measured sweeps in the AM-HiFi Modifications post were done with large signals and high AVC~-5V voltage, so the pentode plate resistance was negligibly high.

Simulation of frequency sweep for various k coupling factors
The following schematic replaces the 1A current source stimulus with a 5Vpeak voltage stimulus to reproduce the test setup. The 1Meg source resistance is included separately from the primary shunt tank losses.
This simulation schematic was run several times with primary/secondary inductances of 640uH, 800uH, 1000uH, 1200uH, 1400uH and 1500uH to match the inductance values that were used in the measured sweeps above.
The fixed 0-800mV scale makes it clear that lower inductance tanks have a lower impedance that produces less voltage drop. The first of the 6 plots below has the lowest level of signal, because the tank inductance is the lowest at 640uH.
Note the reasonably good match between simulation curves below and measured curves above. The voltage scale is the same 0-800mV and so is the horizontal scale from 405kHz to 505kHz.
Each of the values of k is shown in the KIO parameter. KIO was adjusted empirically to get a good fit in the passband peaking. The series resistance was adjusted to match the secondary bandwidth. The simulated bandwidth is reported in blue at the top of the schematic as bw=31102Hz,etc, for example.


Other IF transformer types
![]()
Not all IF transformers are suitable to change the inductance and core posion for overcoupled response. This photo shows two examples that have essentially fixed coupling factor.
The AM-IF transformer type on the left is common in American radios. It uses pot cores that move up and down with their center core sliding into the coil. The outside of the pot core forms the large self-shielding surrounding cylinder. Screwing the pot cores closer together increases coupling, but only slightly, because the amount of travel is very limited. It was not possible to get an over-coupled response with double peaks on either side of 455kHz. The resonating mica capacitors are molded into the plastic base. See the plot of the measured sweep on the left below for parametric details. I used the 1MegΩ//1.5pF 10x p6201 Fet probes for minimal capacitive loading.
The type on the right was the IF ouput of a Grundig SO360. The shielded can has the AM-IF transformer pair on the right and the 10.7MHz FM-IF ratio detector transformer on the left. This construction has fixed cores at the end of the coils that face each other over the wide vertical gap. The alignment is still magnetic with two additional cores that move above the top core and below the bottom core. The resonating capacitors are discrete polystyrene types that are wired inside the can. This design makes it impossible to change the level of coupling by changing core inductance. This is also a step-down design with about a 1.4x turns ratio. The plot on the right was taken with signal drive through a 1Meg resistor into the lower turns bottom coil. I ran the transformer as a step-up. I am surprised at the very narrow bandwidth of only 5.2kHz. I used 1.5pF//1Meg p6201 probes for this measurement. I tweaked the top core very slightly to get a symmetric response. My measured center frequency was 464kHz, which is close to the 460kHz frequency shown in the SO360 schematic.


Conclusions
It is possible to change the coupling factor of IF transformers that have a simple hollow isolator tube with simple screw type cores that are free to slide in and out along the tube.
Measurement of the small values of coupling factor k is pretty tricky with traditional methods and is best refined with frequency sweep simulation verification.
If you are trying to modify the coupling factor of a transformer, you can just srew in the cores to see if the desired response is achievable, even though the resonant frequency is lowered during this check. If you get a satisfactory shape, you can then reduce the existing capacitance to get the transformer approximately back in tune. In the end you fine tune the cores for perfect alignment.
Comments are invited,
Regards,
-Joe
To thank the Author because you find the post helpful or well done.
Measurement of a 455kHz IF transformer
Some old AM sets with two cores and two coils on one threaded shaft have two positions for each core, and the service info warns about this. Usually the farther apart pair of settings are correct. So these quite common IFTs have essently three reponse curves as two of the variations will give similar results (one core in the correct position and the other too close to IFT centre).
I don't know of the resulting alternate responses are useful. I suppose I could use my Rigol spectrum analyser (19kHz to 1.5 GHz) with the built-in tracking* generator, though I remember ploting an IF curve years ago simply with a signal generator and diode detector to a moving coil meter.
[* I found it has a zero Hertz span mode, so with an external attenuator it works as a regular signal generator The -20dBm minimum output is too high power for some applications]
To thank the Author because you find the post helpful or well done.
Both cores moved toward the top
Mike, you pose an interesting possibility for overcoupling.
Of the three possible "wrong" solutions, the case where both cores are pushed into the coil form is not possible with this transformer because the 12.5mm cores are too long with respect the 8mm gap between the coils. The closest I got to this case was with only a 0.5mm gap between the cores shown above with 1500uH coil inductance, but this could only be tuned to 455kHz with a greatly reduced capacitor value from the nominal 126pF that came with the transformers down to 81.6pF.
 The other two "wrong" alignment spots, which are equivalent in opposite directions, are possible to do and still get the frequency response centered at 455kHz with the original internal fixed 126pF caps.
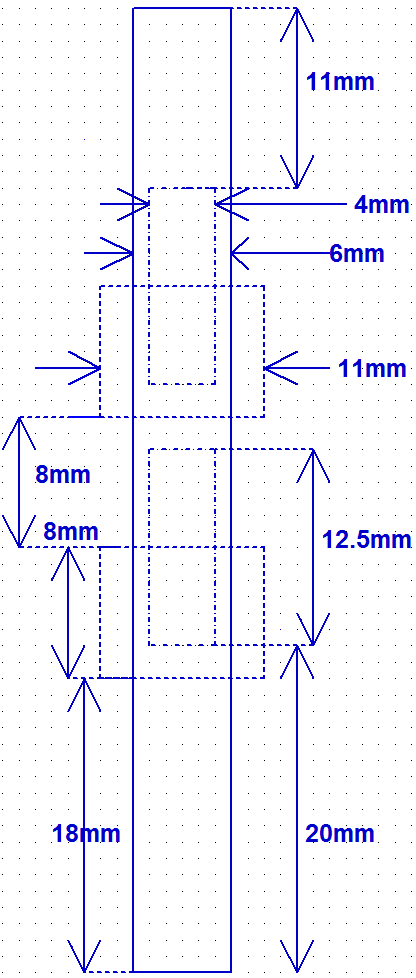
This is the case where both cores are pulled above both coils, or in the symmetric equivalent case, both cores are pulled below both coils. The drawing shows measured distances.
Because we are limited to the original internal 126pF caps, both coils will still have the same 970uH at resonance. Each core is in the same relative position to the corresponding coil, but now the bottom core is within 2mm of the top coil, and the core gap is only 4mm. The original core gap was 12mm.
The resulting frequency response was even more overcoupled than the case where the cores were nearly touching with a 0.5mm gap and the inductance was 1500uH for each coil.
It is interesting that this arrangement produces more overcoupling than the case where the cores nearly touch with 1500uH inductance. In the end, this configuration must share more field in the mutual inductance.
The response shown below has the widest bandwidth so far, of 43kHz, and the distance between the peaks of the blue output curve is 28kHz.
Perhaps having only one transformer in a set, that is this radically overcoupled, it may be possible to get a reasonably flat wide band with several other tanks in the RF/IF path remaining undercoupled to fill-in the trough in the middle of this response. Looking back at the picture of the IF transformers in the Zenith, with its short coils and wide gap between them, it may be possible to get this response.
Note how the response amplitude is about half of the case with 1500uH coils. This is because of the much lower impedance with the original 970uH coil inductance.
The preferred approach for wideband modifications is still to have an adjustable overcoupling factor to obtain a carefully calibrated flat response over all the stages in the RF/IF path.

One reason, beyond the wide band response, why this is the wrong alignment setup in a standard procedure, is that peaking the response during alignment with a fixed 455kHz source would get the 455kHz centered on one of the two strong peaks, thus producing a terribly lopsided overall RF/IF response.
A side thought on μr, the relative permeability of the cores, is that it can be considered to be nearly infinite (μr>50), as compared the the relative permeability of air, which is μr=1. The core works as a magnetic short circuit, magically eliminating the distance between fields outside it. This is fortunate because it means that the stability of the core permeability is not very important, unlike the dielectric constant of capacitors, which fills the entire capacitor gap and affects capacitor stability directly. The inductance value is primarily determined by the magnetic field outside the cores.
Regards,
-Joe
To thank the Author because you find the post helpful or well done.